Tone Generator
User Manual
v.1.6
Tools:
1. Audio Oscilloscope
The Scope will give a digital representation of the waveform being generated or received by the computer's audio device, depending on which input is selected in Windows recording control, accessed via the "Mixer" button. The X and Y scales are automatic and cannot be adjusted manually by the user. We hope to add flexibility to the Scope with additional controls in a future release of ComTekk.
Each trace has a unique color defined on the legend on the right side of the scope window. There is a separate trace for each of Left and Right sound card inputs, which are enabled by checking the "Inputs Enabled" box. To monitor Tone Generator outputs on the Scope, select WAVE input in the Windows mixer control panel.
Checking the "Stay on top" box will cause the scope window to stay in front of any other windows open in ComTekk.
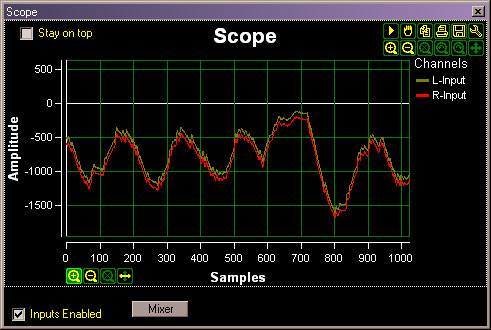
The vertical Y-axis is a relative amplitude of the audio input's A/D converters. For 16-bit audio, the limits are +/- 32767. The horizontal X-axis is represented as A/D samples over time. Sample rate is fixed in the software at 11,025 samples per second, thus 50 samples would represent a period of approx. 4.5 mS, or a frequency of 222.2 Hz.
Positioning the mouse pointer in the upper-right portion of the Scope window will illuminate the special scope functions (enhanced in version 1.5):
Pause/Play, Zoom In/Out, Cancel Zoom, Copy image to clipboard, Print, Save, Settings.
The traces only update when inputs are enabled, and can be paused, acting as a storage oscilloscope. Mouse will also reveal X & Y axis zoom controls, located in the left side of the window.
Scope windows may be resized by dragging the edges or corners.
Note:
The Scope feature is provided as a convience and is not intended to replace hardware test equipment. The automatic scale is relative and does not measure actual voltage levels.
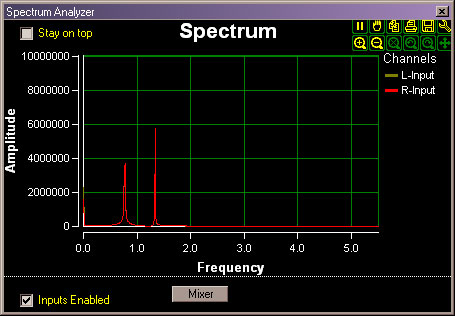
2. Audio Spectrum Analyzer
The Spectrum display functions basically the same as the Scope described above, however the X-axis represents frequency instead of time, giving a graphical picture of the audio frequencies being generated or received. To monitor Tone Generator outputs on the analyzer, select WAVE input in the Windows mixer control panel. Amplitude is a relative representation.
In this example, we can see a DTMF signal being produced by the Tone Generator.